Why do males exist? It doesn’t make any sense.
Introduction: Convergent Structures
Convergent Structures are where two species develop the same characteristics, separately. They acquired like traits because they worked, not because of any shared ancestor. This should be familiar from high school bio.
Birds evolved wings – but so did many and mammals (with the bats). They didn’t all “agree” upon it, the laws of nature did.
Maleness is, clearly, convergent. In Bret’s words, sexes occupy certain niches. But convergent… to what end?
Important to clear up some potential confusion: while traits are heritable, how those traits are passed on is heritable as well. For instance, the propensity to have girls over boys, or the propensity to see more variation rather than homogeneity in offspring – these are all heritable.
Here’s my post on Bret’s “adaptive test”. Let’s put males up:
- Males are complicated. They have specialized genitalia, for one. Moreover, sexual behavior occupies much time of those who study animal behavior. (Sorry, it’s study occupies their time, not its practice).
- It takes a lot of energy to give birth to any offspring, including males. Thus, birthing females and males is (rather than only females, and half as many people), has a cost.
- There can be variation in how many members of a population are born male.
- Males have existed for eons.
Maleness passes the test, so it is an adaption. So males must present some sort of value for the species, otherwise, why would mothers put so much energy into birthing them?
This question merits query because, by an instinctive understanding of biology, it makes no sense that males have any right to exist. Think about it: ultimately, the goal of life is to reproduce. So what could possibly be the benefit of having half of your population physically unable create offspring? Yes, males are part of the reproductive process. But why would species evolve that requirement, rather than the superficially more efficient move of simply making everyone asexual?
Risk
Risk isn’t always equally viable. Here are 2 principles that form a general heuristic about risk-taking:
- The lower the probability of success, whatever success is, the more risk taking is advantageous (higher expected utility) with respect to that endeavor.
- The higher the reward for success, whatever form that “reward” takes (objectively or subjectively) I.e, the difference in utility between success and failure, the more risk taking in advantageous with respect to that endeavor.
That sounds more complicated that it really is, but it’s really just common sense, and you act out its implications every day.
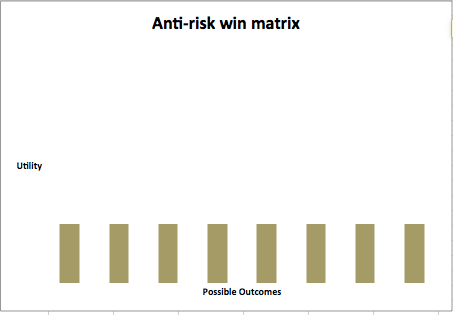
A graph of possibilities where risk is advantageous:
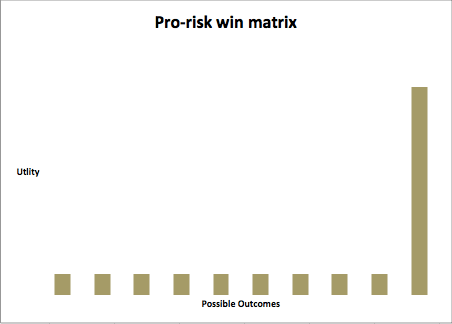
And vice versa:
The heuristic explains why risk-taking is rampant in Silicon Valley. The chance of founding a super successful company is low. However, a successful company could be the next Facebook.
Suppose you are playing first to 10. If the other player is at 9 points and you are at 2, you will want to engage in more risk-taking behavior to catch up. If you don’t, you’ll probably loose anyway; at least by taking risks, you gain some chance of success. A risk like this is what we call a “hail Mary”. The expected utility of risk-taking changed over the course of the single game.
Fundamental Sex Differences
Let’s define our terms. Females bear offspring. Males contribute to the reproductive process, but they do not bear offspring in the way women do. We can extrapolate or explain all sex differences form this set of definitions. Some corollaries:
1. Reproduction is more burdensome on females than males
Human females must invest much more in pregnancy than males. It takes 9 months and places significant strain on their bodies. Males, by contrast, just have to have sex. They can invest more, if opportune, but not a physical necessity.
Consequently:
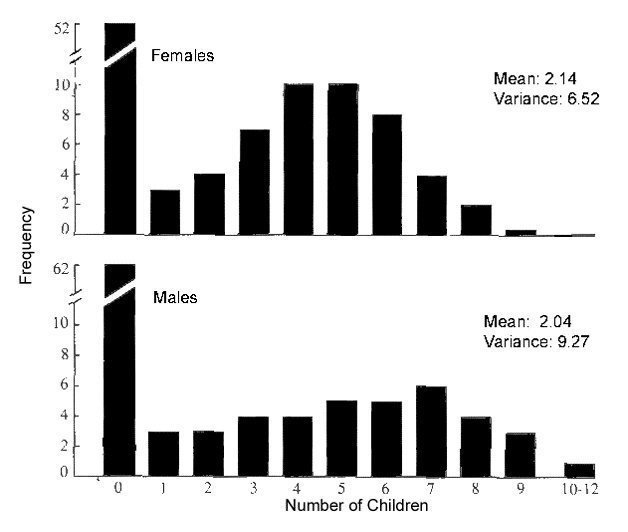
2. Males are able to have many more offspring than females.
Female reproduction requires the time commitment of however long it takes to bear offspring. Consequently, there is an upper limit on the number of children a woman can bear.
The same time commitment is not placed on males. Men will virtually never run out of sperm. The only upper limit is the number of partners they can acquire and mate with.
Of course this dynamic is rarely relevant to modern human society in a physical sense, but the dynamic undoubtably shaped human evolution.
For females, the number of partners does not impact the number of children they can bear in any substantive way.
As a consequence of #2:
3. Risk-taking is more evolutionarily advantageous for males than females.
Recall our heuristic on risk-taking from earlier.
- The potential upside of male “success” is very high, because there is hardly any upper limit on on how many offspring a male can have.
- However, males are in competition. If some males mate with many females, then mathematically, a number of other males will be left with no mate. Thus, the “chance of success” is lower for males than for females.
- Females by comparison are at low risk of not being able to mate at all, because it costs a male virtually nothing to have no-strings-attached sex with them. Females may compete for male commitment, or high-status men, but they don’t compete for the ability to mate with someone.
Comparing against the risk-taking heuristic, it is easy to see how risk-taking behavior is evolutionarily beneficial for men. You need to risk to win, but if you win, you win big.
4. Males are more disposable.
You only need one male to repopulate a whole village. The others may provide useful function, but they are not needed for the core function of reproduction.
This disposability plays into their propensity to take risks.
Variation

In this graph are overlapping bell curves. As you can see, the red one is skinner and taller, while green is shorter and wider. The definite integral of all three curves is the same, only some have fatter tails.
The X-axis represents variability in a trait, any trait. It could, for instance, represent the number of IQ points. The Y-axis represents a number of individuals who possess that trait. What we call a “bell curve” here represents the distribution of a trait within the population. You can draw all bell curve for virtually any human trait, including physical traits, intelligence, and metrics of behavior.
Try to guess: which of these curves represents a strategy with more risk?
Here’s a hint, if you don’t get it: the center of bell curve is “playing it safe”. It is just displaying the trait in a similar way to how many others have before you. It is a time-tested strategy. Enough people have survived with that X-value to pass their genes, evidently. It is “proven territory”, if you will.
the risk is on the ends. It represents deviation from the treaded path.
Guess which type of bell curve will represent a male trait, vs which will represent a female trait? From physical traits, to personality to intelligence, males seem to display a wider distribution (more variance) than females. It’s called the Variability Hypothesis. This could partially explain why men occupy both higher and lower strata than women.
Males evolved the propensity to be born with a larger distribution of traits because risk-taking is unusually beneficial for males. I don’t just mean risk-taking behavior, I mean a a phenotype with risky traits to exhibit. Being different than normal is a risk, but sometimes pays off, as I will explore in the next section.
The Adaptive Valley

This is the “adaptive landscape”.
The X-axis represents variability in a trait. For the sake of simplicity, the graph only represents one dimension, although actually many traits are important.
the Y-axis represents how good it is for the organism.
Peaks 1 and 2 are relative maximums on the distribution. If you are dropped off at a random spot on the curve, and you gradually inch upward, you will end up on either peak 1 or 2.
This is a problem: what if you end up on peak 1? In order to go up, you first have to go down. Unless you spontaneously try something radically different.
Natural selection is a process of trial and error. Through variation in the offspring, you effectively test traits against the environment to see what works.
If not for the valley on the adaptive landscape, then even the most incrementalist, gradualist approach to evolution would work. Even the smallest variation in traits would eventually, given enough time, would tend towards the peak.
But in practice, we have to face a problem: how do you cross the adaptive valley?
Recall the bell curves graph from the previous section on. The X-axis is similar enough that we could effectively superimpose the two graphs.
Of course, this is all theoretical – in real life, a phenotype has not one trait, but a combination of many traits that interact in complex, interdependent ways. (That’s why you need so many organisms on the tails of the bell curves: to test out different trait combinations.)
We can represent multiple x-axis variables in 3D:

The Y-axis of the adaptive valley graph represents a sort of “payoff”, which we can connect to the section on risk-taking. Males often exhibit traits on the ends of the bell curves, in search for new peaks on the adaptive landscape that present growth opportunity.
In other words, males are nature’s testing grounds. If not for males, you wouldn’t have the weird mating dynamic of risk and payoff, and offspring variability wouldn’t be as profitable (and so not pursued to the same effect, as with species that produce asexually). The bell curves would be thinner, and the adaptive valley less explored.
The male-female mating dynamic incentivizes half of the species population to be given “risky” traits at birth, as a means of exploring the adaptive landscape.
Explaining Human Behavior
This all explains a few thing about gendered behavior.
Males are more prone to risk-taking activity. If you have spent any time around teenage boys, you know this to be true.
Males are more competitive. Their genome acknowledges the inherently competitive nature of male life, where reproductive success is not a given.
Evidence that these behaviors are evolved to influence reproductive success, aggressive, self-destructive, and risk-taking behavior spikes for males in the 16-30 age range, or around when males are on the hunt for mates.
Compare the hobbies/sports/etc. popular among men with those popular among women. The difference follows the above trends.
Another distinction between males and females is that of systematizing vs empathizing. Males care more about systematizing so as to optimize their upward mobility in an inherently competitive structure. Females care more about the goings on of other people, perhaps because “following the group” is a way to fall closer to the center of the bell curve.
But … why are there so many?
Ok, so I have answered why males exist. But why are 50% of humans male? Isn’t that an awfully high number for people that ostensibly just exist for genetic experimentation? 50% is an awfully round number; why exactly one half?
Perhaps it would be better from an evolutionary perspective if there were fewer males. Perhaps not. We may never know, because species’ don’t develop propensities that are profitable for the whole population, they evolve propensities that are profitable for individual organisms. It’s a collective action problem.
A certain negative-feedback-loop pulls the number of males towards one half. Whichever sex is less common will be more genetically profitable on average. The species will evolve the propensity for reproducing the sex most genetically profitable, over time bringing the average number of males to match that of females.
If you prefer this concept explained in video form (after all, I might get something wrong), you can watch Bret and his wife explain it. I haven’t watched it, but Bret made it, so I assume it’s good. Actually, this video is what first got me thinking about the concept, but it doesn’t do a very good job at explaining it (and the title is misleading).
I will now prove that whichever sex is less common is more genetically profitable.
Let M = the male population, Let F = the female population, Let M1 = average children per man, Let F1 = average children per women
Now for an important equation:
The average number of children per man, divided by the average number of children per woman, is equal to the female population divided by the male population.
In other words: M1 / F1 = F / M
This has to be true, by definition, because every offspring has both male and female genetic parents. So “children per man” is just the number of offspring divided by the number of men, and vice versa.
On to the math:
If M>F
- F/M < 1
- M1/F1 < 1
- M1 < F1
If M>F
- F/M < 1
- M1/F1 < 1
- M1 < F1
QED
This is a statement of true equality. From an evolutionary perspective, both sexes are equally valuable. That is why we have mostly equal numbers of each.
