See the image below. Imagine you start at the dot. Your job is to construct roads, in such a way to minimize the time spent traveling. It needs to be possible, starting at the dot, to arrive anywhere at the line.
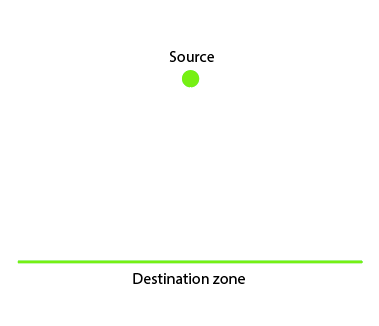
Here is the challenge: how do you construct the roads?
If cost is not a factor, you will construct the roads something like this:

The more roads, the faster the journey. We are imagining that roads cost nothing.
But in real life, this is not the case. Roads cost money and effort to build and maintain. We can improve our challenge by asking you to build roads such that (travel time / amount of road) is maximized. The solution might look something similar to this:
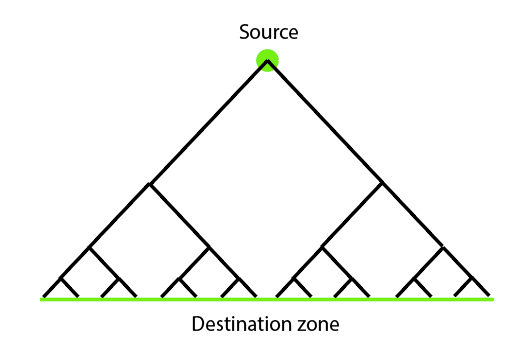
You use branching.
In the previous image, the closer you got to the dot, the closer together the roads were. Higher up in the image, a lot of people are traveling in roughly the same direction anyway.
This improved design takes advantage of that by efficiently combining the many close-together roads into one big road.
I will tentatively call this the “branching problem,” (until I’m corrected by someone knows the actual name). This problem has interesting implications for roads in real life. For example, it adds detail to this underrated post.
But it also has implications that are much broader than roads. This is a picture of all of the nerves in the body:

It’s the same problem. You have a starting point (the brain). You have end points (the muscles). You need information to travel from the former to the ladder. You get a branching system, like on a tree.
Which reminds one of literal trees.

You have a source: the ground that the trunk emerges from. You also have a “destination” of sorts: surface area of sunlight-receiving space, which is just to say that the leaves need to be sufficiently spread out. The “branch path” from leaf to ground should be as short as it can be, for the purposes of structural integrity. And so you get the branching pattern.
By now, you can probably recognize the tree pattern, even if you’re not a programmer. This pattern, actually called a “tree” pattern, is absolutely fundamental in computer science. A “tree” is essentially a hierarchical (non-circular) network (actually “graph”, but a computer science graph means something like this).
The Last Mile Problem
One consequence of a tree pattern can be the last mile problem. The last mile problem is the problem that, in transportation networks, the last mile of transport accounts for a vastly disproportionate amount of expenses.
Suppose you are a shipping logistics company, like Amazon. Now suppose most of the goods you ship were manufactured in China. Which is a bigger expense: 1) getting the goods from China to your distribution centers, or 2) getting the goods a mile away from their final destinations to their destinations?
#2 is a disproportionately over-represented expense. That’s because it’s most efficient to do most of the fine “spreading out” closer to the destination. Let’s look again at the picture from above:
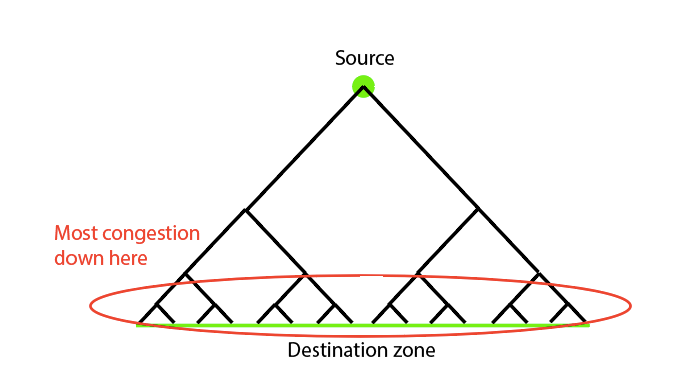
As a shipping logistics company, you run distribution centers. Suppose one big truck enters a distribution center. Many smaller trucks exit. You need many more trucks to take the goods away, because, unlike the incoming truck, the outgoing trucks are all going in different directions.
The “last-mile-problem” is really a “shared-path-near-origin” solution. Which is to say, the closer you get the origin, the people/goods/data you are moving can take the same path, and can therefore be moved in bulk (which is much more efficient than accommodating many divergent paths). To give an example: a train which travels long distances will be able to carry hundreds of people, whereas a bike (which travels a shorter distance) can only carry one person.
Hierarchies
The tree pattern also shows up in org charts.
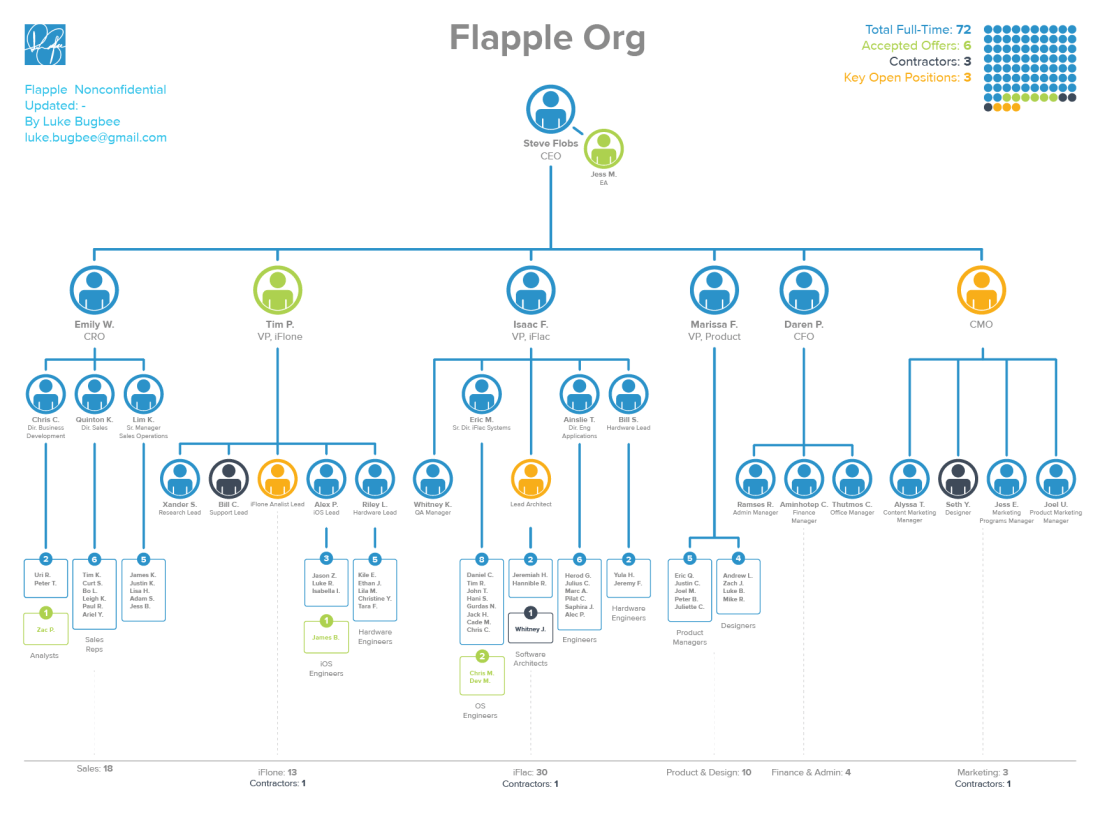
Most org charts, like that one, are truncated, partially hiding their tree-like nature. But the hierarchy has a branching pattern. You see your boss, your boss’s boss, and so on. Multiple people are under you, with multiple people under them, and so on.
Hierarchies in large orgs aren’t typically a liner ordering. They display a tree structure, meaning an employee has superiors, subordinates, and peers. Have you ever wondered: who invented this pattern of human organization? What bygone sultan dreamt up this tool for oppressing the masses?
No one; this was not an invention. This was a convergent pattern that many organizations settled on, because it’s efficient. Orgs that failed to adopt the pattern didn’t last very long in the Darwinian struggle.
I want to posit that this is really a sort of “shared-path-solution.” Here’s how.
An organization is comprised of many people who have to make all sorts of choices. Picture the set of all challenges that members face. Each of these challenges demand choices. But some of those challenges are shared among many people in the organization. You could ask all the members to come up with their own solutions, independently, but that would be inefficient. It’s much more efficient to designate a single person to make the choice once, and then ask everyone else to copy that choice. The more people are affected by the choice, the “closer to the origin” of the org chart you get.
Some people find it obscene that a CEO can make thousands of times more than their employees. A CEO may be working harder than their employees, but are they really working 1000x harder? If not, why do they deserve that much? The answer is it’s not a question of effort, but the value they produce. If you’re in charge of a firm with 10,000 workers, your choices are multiplied across those 10,000. If you make a choice that improves everyone’s efficiency by 10%, you’ve created a thousand workers worth of value.
You have probably heard of the 80-20 rule. 20% of the inputs (like workers) are responsible for 80% of the outputs (like earnings). If you do the math, it’s also the 64-4 rule. And the ~50-1 rule. To be honest, I question the accuracy of those numbers. But a basic principle remains: moving up a hierarchy leads to exponentially increasing results.
Fractals
To say that something is “fractal” means it’s scale-independent. For example, if you look at a close-up of the surface of the moon, you don’t know exactly how close you are by looking at the craters, because there are craters of all sizes. Comparing their relative sizes yields little useful information. Back to hierarchies-
People at the very bottom and very top of the hierarchy have a quantitatively different experience than those in the middle. But for everyone else, those in the middle, they have X number of direct underlings and Y numbers of direct superiors. The size of X and Y depends on the branching pattern that the org is using.
But X might end up being the same wherever you are placed in the hierarchy. Therefore, no matter how much your rank improves, your relative positioning seems the same, because there are the same number of people directly above and directly below you. You don’t see the total number of people above and below you, only those directly adjacent to you on the network.
You measure your status relative to those around you, the people you interact with, i.e., the adjacent nodes. And so, the more your status improves, the more it seems to stay the same.
