This was written by a a different author than usual; it is a contribution from the editor. It is the first of a two-part series. Part 2
Have you ever felt an inner sense of social momentum? In microcosm, this sense can be the feeling that a group project is moving inexplicably towards one direction or set of goals and its course cannot be turned around. In macrocosm, this sense can be a feeling of a culture falling towards a certain direction or ideology. At what point does a group’s momentum, however big or small, fall towards one direction or another? Social scientists and historians often use contextual evidence and a chronology of events to describe the process of how social systems flip. But society is a machine with each individual operating as a node, and these sorts of explanations merely put together a coherent narrative of the outputs form this machine rather than its inner workings.
To address this problem, I have developed a model that illustrates how, why, and when societies adopt one game-theory and network dependent social system over another. This model can be universally applied and contains set and measurable variables (as measurable as you can get with the social sciences, that is). For reference, the best instance where this model applies is in revolutions, when one government replaces another. This model that I have constructed combines math, physics, and social forces to determine the state of society’s functioning. Since this is a long-developed theory, I have divided is presentation into two parts. This first part exclusively establishes my model and how it works. The second part will enumerate my model’s implications and applications as well as historical examples and special cases. My second part will also address potential problems with implementing this model and how they can be addressed.
In all, my model is depicted by the graph below.

Now it may look intimidating at first, but in most simple terms, all you have to do is think of it as a population diffusion graph with a ball on it. Now imagine that all the physics of a ball on a hill apply. The ball is the new system, the location of the ball on the hill shows the percent of social adoption of this system, and all of the forces and properties that determine how the ball moves in a regular physics problem are replaced with social factors while maintaining their physical functions. The better you remember your physics I class in high school, the more this will make sense. If you don’t remember anything from physics class, don’t worry – I will cover every part in detail.
A key component of this theory is that it only applies to social systems that exist dependent on their execution being the dominant strategy in game theory. If you already know how game theory and dominant strategies work, skip to the “diffusion graph” section. If you don’t I highly recommend you make yourself familiar. In essence, game theory is about how people make certain decisions when they are affected by others that make decisions. A dominant strategy is the most logical decision an individual will make with certain knowledge of other individual’s options, even if it does not produce the best overall outcome.
Another important thing to point out is that this theory only applies to systems where only one system can exist within a single society at once, so any new system would necessarily be competing with the presiding system.
Diffusion graph
First let’s take the graph in isolation to see what it represents. This graph is a population diffusion graph, and looks like this:
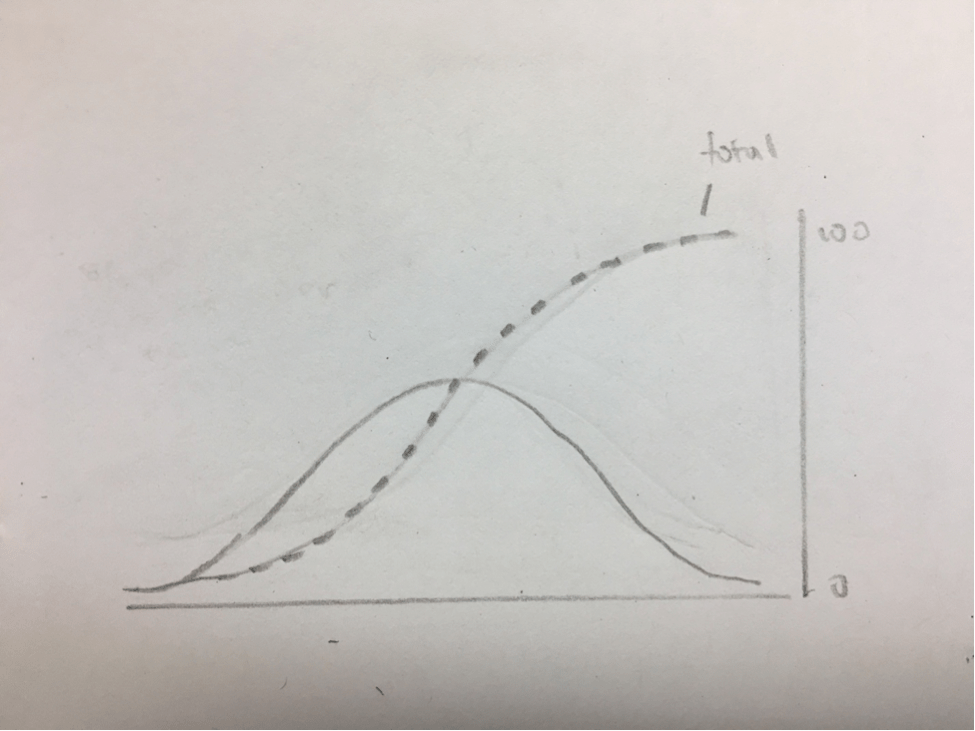
In this case, the area under the graph from T=0 to T shows the percent of the population subscribed to a social system at time T. In mathematical terms, this is the line of the derivative population adopting a system. If you understand what that means and its implications, skip the next paragraph.
The height of each point on the graph represents the speed at which the population is adopting a system at that point. Notice how if you were to take an area under the curve between two high points and the area under the curve between two low points over the same period of time, the area between the two high points would be much larger. In other words, when the points are higher people are subscribing to the system at a faster rate, and when they are lower people are subscribing to the system at a slower rate. Consequently, when the curve is going up, the rate at which people are subscribing to the system is increasing, and when the curve is going down, the rate at which people are subscribing to the system is decreasing.
Now that we have that graph, it’s time to introduce the ball.
Location of ball
The location of the ball represents the point that the new system is at with society. As mentioned when describing the diffusion graph, to see how much a system has been adopted within society, draw a line under the location of the ball to where it hits a time T on the X axis, and the area underneath the graph from the ball’s starting side (T=0) to the line is the percent of the population that has adopted the system.

Variables of ball
This is where things get interesting. Like I said before, imagine that the population diffusion curve is a hill, and the ball follows all the regular laws of physics. If it might help by refreshing your memory, this is how the forces acting upon the ball to dictate its movement is depicted in physics class:

The only difference in my case, is that the fundamental forces of physics has been replaced by the fundamental forces of society. Therefore, under this model we can deduce all sorts of things about how society is functioning based off of how the ball is moving.
Basic outline
Here are the main variables in the graph. If you know these variables in terms of physics, start to guess how they apply in terms of society.
- g(gravity) = the force of the dominant strategy
- theta = incline of line = “ingrainedness” of social system
- m(mass) = size of new system/change
- S(g) = mgsin(theta)
- S(f) = Social Force
- Ball velocity = social momentum
- Ball height = social potential energy
G – dominant strategy
Think of g as gravity. Gravity, like idea of a dominant strategy, exists independent of whatever it is acting upon and is constant in its exertion. What makes the difference in how gravity acts upon objects isn’t gravity but the properties of the object itself. Likewise, the logic of game theory and the presence of a dominant strategy will remain constant, and its influence depends on properties of the new social system.
What’s absolutely key to this theory is that gravity will always push the ball either towards to the right of the curve or to the left of the curve. Translated – whichever social system with over 50% participation will have their system as the dominant strategy. As defined by the curve, the point in which the curve is flat is infinitely small, so it is impossible for the ball to linger at the top. Just how the tipping point of the ball is at the top of the curve, the tipping point for society is at 50% of the population. Thus we have a solidified identifier for when society has tipped towards one way or the other.

Theta: angle of incline
Theta is the angle between the slope at a certain point and a perpendicular line through that point. The greater theta, the greater the force of gravity is working against the ball, and the harder it is to push the ball up the curve. The height of the curve, and by extension the size of theta, is determined by the degree to which the category of social system is ingrained and entrenched within society. For example, language is a social system category which would have an extremely steep curve, because its use is interwoven with almost every way we think and interact, and it is deeply implanted into our psychology. A social system category with a much shallower curve would be something like social media. Social media is game theory dependent because although your use of social media is dependent on the fact that everyone else uses it, it would not fundamentally alter your lifestyle to switch over to a competing social media platform that offers similar services.
Things get interesting when you start to think about how the size of theta impacts how a social system can be introduced and adopted. With a more ingrained system category, we see that much more people must adopt the system in the same amount of time in order for the ball move up the curve. If a social system isn’t able to galvanize the population to adopt that system at a speed necessary to cover the steepest portion of the curve, then it will never be successful. The steepest point of the curve will also kick in at a specific time, so the most effective strategy for a new social system involves syncing up its degree of support such that it is proportional with the steepness of the curve.
M – size of change
The last variable to consider in terms of the inherent physics of the ball is its mass. The mass of the ball represents the size of the new system. By postulating the exists of very low-mass balls, we discover the process of social change through incrementalism. Consider a very small ball in the system category of language. This very small ball would make up a different use of a word or phrase being introduced into society. Over time, if many small balls traversed the curve, they could eventually add up in mass to one big ball, which may equal a different language altogether. As another example, instead of everyone switching over to one leader all at once, the duties and following of the leader could be gradually assigned to another individual until the original leader loses power. This is how game-theory dependent systems evolve over time rather than overhaul over a much shorter period of time. There are two caveats to this analysis, however. The first is that it is just as easy for the opposing system to launch their small balls in the other direction, so the most impactful change happens when one side is able to muster a very large ball that can be launched over the hill in one go. The second caveat is that if each ball has an incredibly small mass, the forces necessary within the model would also be incredibly small, so the application of this model would generally loose importance. For the model that I have created, it provides the most use and insight when dealing with social change that happens suddenly and substantially.
S(g)
S(g) or social gravity is when the forces of m, g, and theta all come together to create the overall force pushing the ball down and towards one side. The overall force of social gravity is calculated by (m)(g)sin(theta). Theta is inputted with sin because that’s how physics works.
S(f) – Social Force
The social force is what pushes the ball over the curve. In order for a social system to reach the tipping point, the following condition must apply: S(f) – S(g) > 0. There are in fact many forces working in society at any point in time, so S(f) isn’t a single force but a net of all forces. Therefore, S(f) is actually equal to S(fA) minus S(fB), where S(fA) are the forces pushing the ball to the right and S(fB) are the forces pushing the ball to the left. Note that the social force can work in any direction at any time. Once a system crosses over the tipping point, the social gravity begins to work with the social force, which is what makes crossing the tipping point so powerful.
Now that we have the variables established, we can start to think about how the movement of the ball traveling along this curve reflects certain aspects of social change all working as a function. The ball begins by easily traveling along a shallow curve, picking up those who operate on the fringes of society and often hold contrarian beliefs. As the ball moves further and the system spreads to a wider society, social gravity begins to come into force. Social gravity is strongest at the 25% point, where the system is used enough that it has a presence in society, but small enough that the new system determinately does not have the sway of the dominant strategy and the opposing system still has almost all the power. When the ball reaches the top of the curve, since each system has a sufficient percent of the population, social gravity matters much less than the two opposing social forces battling against one another. Just like how a ball would accelerate when falling down the curve, the adoption of a certain system will accelerate once crossing the tipping point unless acted upon by an opposing social force.
Examining this model and how the ball moves and the physics work across every instance can lead to fascinating conclusions. This and much more practical application will be laid out in the second part of this series. In the mean time, I encourage you to think of how the model works and come up with ideas of your own.
